Reporting on Surveys
You have various possibilities to analyze the given answers to your survey questions. Survey insight is very important for any company. You will gain a better understanding of your company, your industry and your products
Navigation for User - Survey
1. Question Around with Surveys 1.1. Creating a Survey 1.2. Design for Surveys 2. Design for Category Checklist 2.1. Question Types 2.2. Further options for questions 2.3. Branching 2.4. Attachments for Questions 2.5. Dynamically Display Answer Options 2.6. Actions and Tabs 3. Design for category Products 3.1. Design for Survey Category Products 3.2. Product Determination 4. Design for category Registered Products 5. Design for Competitors 6. Design for Competitor Products 7. Design for category Satisfaction 8. Validation Rules with Exceptions 9. Language Settings 10. Score 11. Follow Up Actions 11.1. Follow-up Tasks and Follow-up Tickets 11.2. Follow-Up Sales Quotes and Sales Orders 12. Question Bank 13. Usage of Surveys 14. Reporting on Surveys 14.1. Tab Results 14.2. Reports
There are two main aspects of how you can analyze surveys. The first is to analyze the results directly in your surveys. By default, in C4C there are charts and metrics that you can use. The second approach is via reporting, which you can design and build individually. Both approaches are explained in detail in the following chapters.
14.1. Tab Results
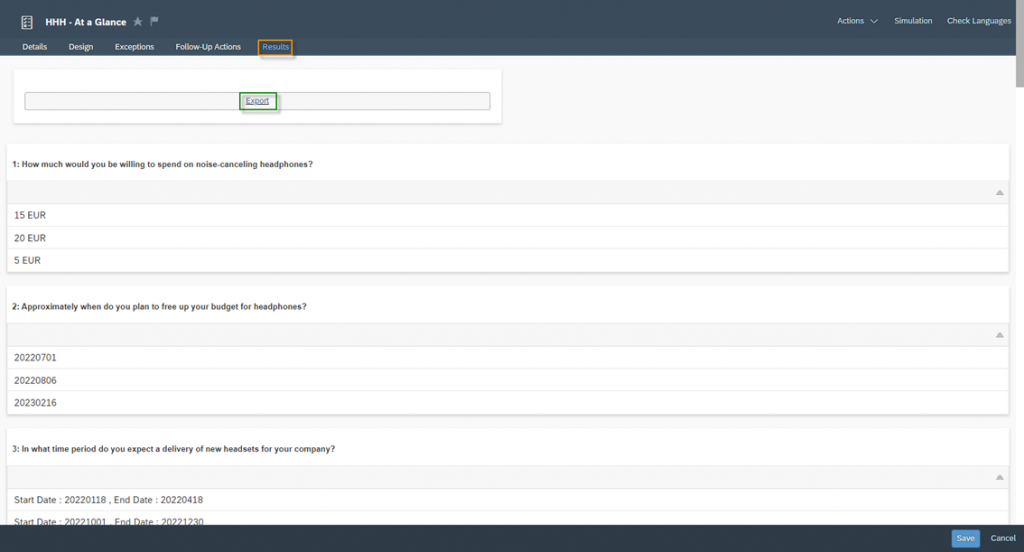
In each survey you will find the Results tab. Once your survey has been completed and submitted by one or more respondents, you can view the results here – that is, the answers given to your questions. You can also download the answers as a .csv file via the Export button, so that you can eventually perform further analyses in Excel.
14.2. Reports
You have the possibility to create individual reports via the Work Center Business Analytics. The following data sources are available for the analysis of the survey:
- Business Partner Survey Answers
- Lead and Surveys
- Lead Survey Answers
- Opportunity and Surveys
- Opportunity Survey Answers
- Perfect Store Visits and Surveys
- Survey Answer
- Ticket and Internal Surveys
- Ticket Survey Answers
- Visit Survey Answers
- Visit Tasks and Surveys
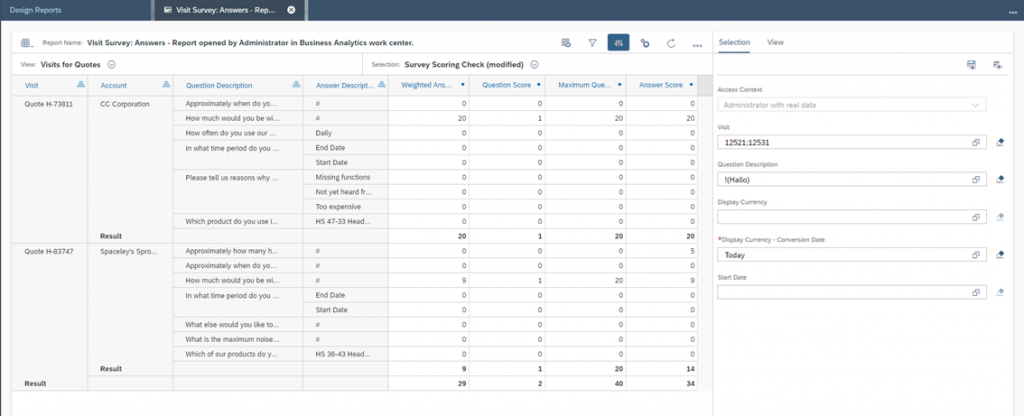
You are also able to extract all information from these data sources. Number of answers given, response rate, direct answers to questions, survey scores and much more. In the figure below you can see an example of the Visit Survey Answers data source.
You can also use the above data sources to evaluate scoring for your survey. There are essentially four key figures, which are important to be able to interpret the scoring correctly:
Weighted Answer Score:
Is the number of score points that the respondent achieved when completing the survey
Question Score:
Is an indicator where score values are stored. 0 means that no scoring value can be achieved for this question and 1 means that a scoring value can be achieved for this question
Maximum Question Score:
Is the number of maximum scoring points to be achieved
Answer Score:
Is the numeric entered answer to the question types of Amount, Numeric and Quantity
Below you can see an example reporting for two visits and the corresponding scoring values.
The Customer Experience team at Camelot ITLab deals with exciting and challenging CRM related topics every day and serves a large portfolio of different customers from a wide range of industries. Trust in this collaboration and feel free to contact us at tlil@camelot-itlab.com.
Was this article helpful?
If you like our content we would highly appreciate your review on Trustpilot
#SAP C4C #SAP Cloud 4 Customer #Cloud 4 Customer #Cloud for Customer #SAP Sales Cloud #Sales Cloud #Survey #Reporting #Result #Results


