OData API
OData Monitor
With the help of the OData Monitor, all API requests can be monitored and analyzed
Navigation for OData API
1. Test SAP Sales Cloud OData API with Postman 1.1. OData 1.2. Postman 2. GET Requests 2.1. SAP Sales Cloud Object Collections 2.2 Metadata 2.2.1. Principle 2.2.2. Attributes 2.2.3. SAP-Attributes 2.3. Work with Parameters 2.3.1. Filter 2.3.2. Work with Dates and Datetimes 2.3.3. Orderby 2.3.4. Top 2.3.5. Skip 2.3.6. Format 2.3.7. Select 2.3.8. Count 2.3.9. Inlinecount 2.3.10. Expand 2.4. Examples of GET Requests 2.5. Build OData Queries for Reports 3. X-CSRF-Token 4. POST Request for creating 4.1. Single POST Request 4.2. Create multiple entries with $batch 5. PATCH Request for updating 5.1. Single PATCH Request 5.2. Change multiple entries with $batch 6. DELETE Requests 7. OData Monitor 8. OData Service Explorer 9. Enable customized fields for the API interface 10. Connect Mircosoft Power BI® with SAP Sales Cloud API 11. Deep Links for URL to SAP Sales Cloud Objects
You can find this monitor in the Work Center Administrator, in the Work Center View General Settings. In the tile of System Administration click on OData API Monitor, to view the API Requests and open the Monitor.
If the OData Monitor cannot be found there, you must first activate it via your Scoping Project. To do this, open the Scoping Project in the Business Configuration Work Center. Navigate to 4 – Questions. You can find the scoping questions in the scoping element Communication and Information Exchange → People Collaboration, Intranet and External Services → Communities, Document Management and External Services.
Question: OData Monitor – Do you Want to Enable Monitoring of OData Inbound calls?
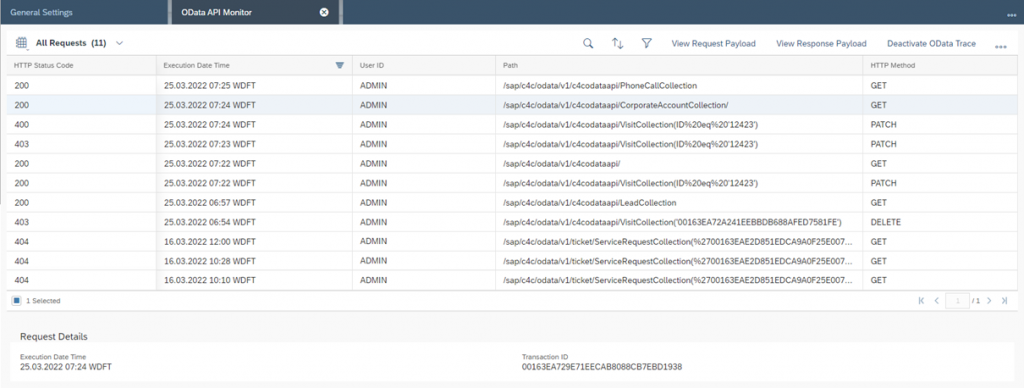
With this OData Monitor you have the possibility to view the HTTP Status Code, Execution Date Time, User ID, Path, HTTP Method and Transaction ID for each OData API transaction. You can decide whether you want to activate and deactivate the OData Trace. The Activate OData Trace and Deactivate OData Trace buttons are available for this purpose. If you activate the trace, both successful and failed API requests are monitored. Successful requests are logged for three hours and failed requests for 15 days. If the trace is deactivated, only the failed API requests are logged. You can view both the Request Payload as well as the Response Payload for each selected transaction.
The Customer Experience team at Camelot ITLab deals with exciting and challenging CRM related topics every day and serves a large portfolio of different customers from a wide range of industries. Trust in this collaboration and feel free to contact us at tlil@camelot-itlab.com.
Was this article helpful?
If you like our content we would highly appreciate your review on Trustpilot
#SAP C4C #SAP Cloud 4 Customer #Cloud 4 Customer #Cloud for Customer #SAP Sales Cloud #Sales Cloud #OData #API #Monitor #OData Monitor


