Perfect Store - Set Up KPIs
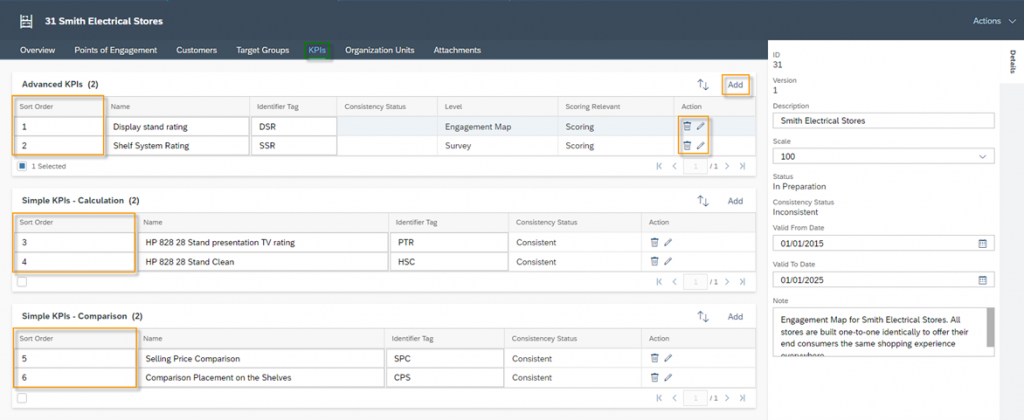
With engagement maps, three different types of KPIs can be created to evaluate key metrics about the stores visited. These KPIs are used in the performance measuring of the stores
There are the following three types of KPIs for measuring metrics about the stores visited:
- Simple KPIs – Comparison
- Simple KPIs – Calculation
- Advanced KPIs
These KPIs are determined on the answers to questions from Product Surveys. These surveys are included in the Points of Engagement. All setting options can be found in the KPI tab in the Engagement Map. With the Add Button new KPIs can be created, removed with the Trash Icon ![]() and edited with the Edit Icon
and edited with the Edit Icon ![]() . Another important setting is Sort Order. With this Sort Order you can decide in which order the KPIs should be displayed when performing the Perfect Store Visit. Make sure that you firstly use only unique values for all KPIs and secondly that they use positive values – starting from 1. Otherwise, the system will return following warnings:
. Another important setting is Sort Order. With this Sort Order you can decide in which order the KPIs should be displayed when performing the Perfect Store Visit. Make sure that you firstly use only unique values for all KPIs and secondly that they use positive values – starting from 1. Otherwise, the system will return following warnings:
- Please enter a unique value for sort order
- Please enter a positive integer value as sort order
3.1. Simple KPIs – Comparison
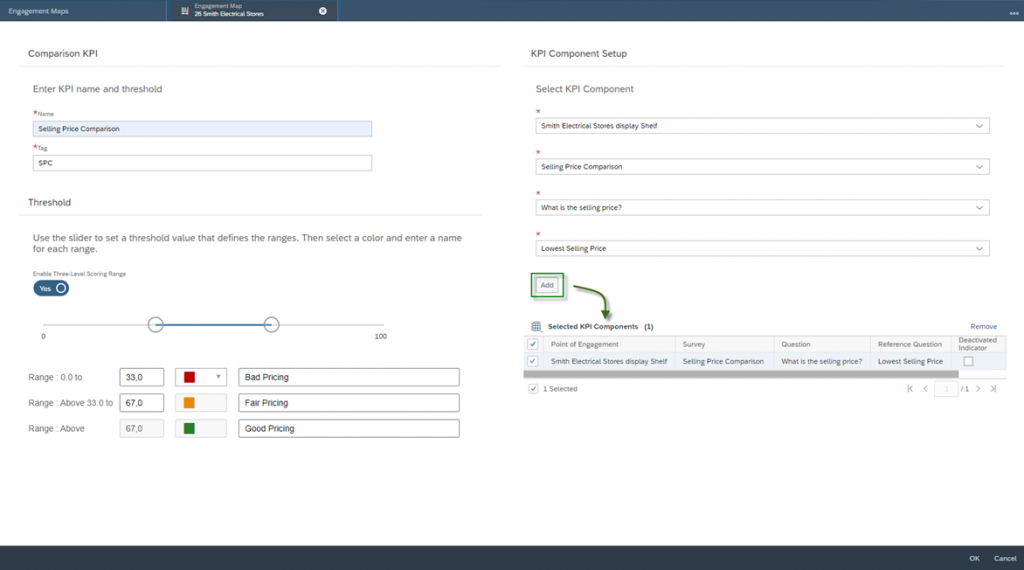
With this KPI, you have the ability to compare the response of a given Amount or Quantity Question during the store visit to a Product Extension or Product List Extension Field. Proceed as follow for this KPI:
Name: Define a name for your KPI
Tag: Assign a tag as a short name for your KPI
KPI Components
Point of Engagement: Select the Engagement Point on which you want to base your comparison KPI
Survey: Select the survey. Note that only surveys with the Category Product can be used. The survey has to include at least one Question of the Type Amount or Quantity and at least one Question of the Type Product Extension Field or Product List Extension Field
Question: Define the initial question for the comparison. Questions of type Amount and Quantity are available
Reference Question: Select the reference question that is of type Product Extension Fields or Product List Extension Fields. Whenever the given answer to the question is equal to this reference question value, then this answer is evaluated with the value 1, if not with 0
Threshold: To be able to compare your calculated key figure in terms of a KPI, you need the threshold values. Enter the value ranges – two or three ranges – define the threshold values and enter a description for each range.
Example:
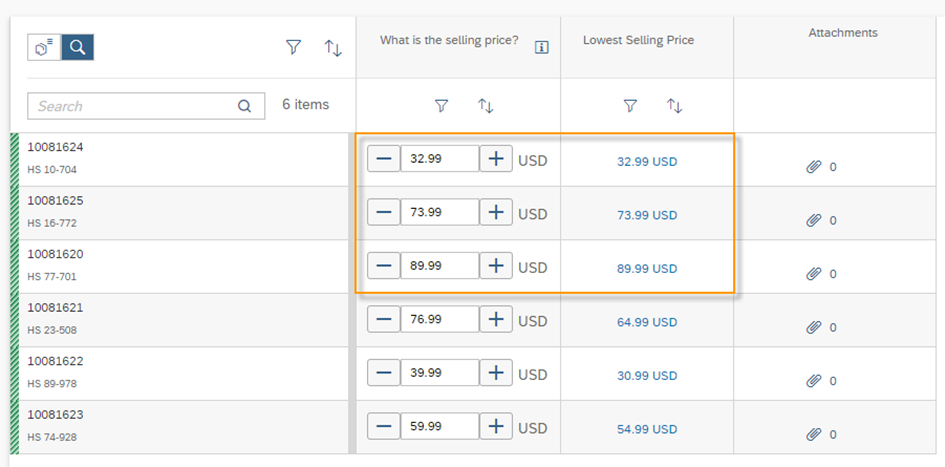
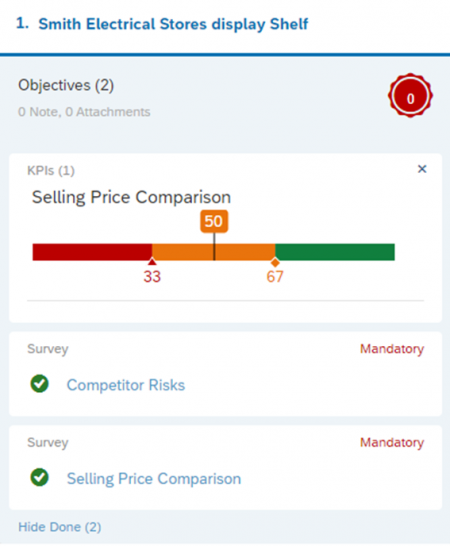
You have implemented the Product Extension Field Lowest Selling Price in your company to ensure that there are no negative margins for each sell. You want to evaluate your customer’s pricing with a KPI and created for that the survey Selling Price Comparison which includes six products that customer Smith Electrical Store sells on his shelves. You included in the Survey the Question What is the selling price? of the Type Amount and the Product Extension Field Lowest Selling Price. The creation of the KPI is shown in the figure below:
When performing the visit, the sales representative fills in the Price Comparison survey and finds that the first three products are sold based on Lowest Selling Price.
In the calculation, the first three answers are now assigned with one point and the last three answers are assigned with zero points. In the overview tile of the corresponding Engagement Point, you will now find the KPI displayed and evaluated to the value 50.
3.2. Simple KPIs – Calculation
With this KPI, you have the ability to compare the response of a Multiple-Choice Question to a predefined Response Option. You can only use one question with one answer option per survey, otherwise you will receive the following error message: Only one question per survey allowed in KPI. To create this KPI Proceed as follow:
Name: Define a name for your KPI
Tag: Assign a tag as a short name for your KPI
KPI Components
Point of Engagement: Select the Engagement Point on which you want to base your comparison KPI
Survey: Select the survey. Note that only surveys with the Category Product can be used, which includes at least one Question of the Type Multiple Choice (select one)
Question: Define the question for the calculation. Only Questions of type Multiple Choice (select one) are available
Response: Select a response from the multiple-choice question. Whenever the given answer to the question is equal to this response, then this answer is evaluated with the value 1, if not then with 0
Threshold: To be able to compare your calculated key figure in terms of a KPI, you need the threshold values. Enter the value ranges – two or three ranges – define the threshold values and enter a description for each range
You can include as many different questions as you want in this KPI. You can then use only one Response Option per question.
Example:
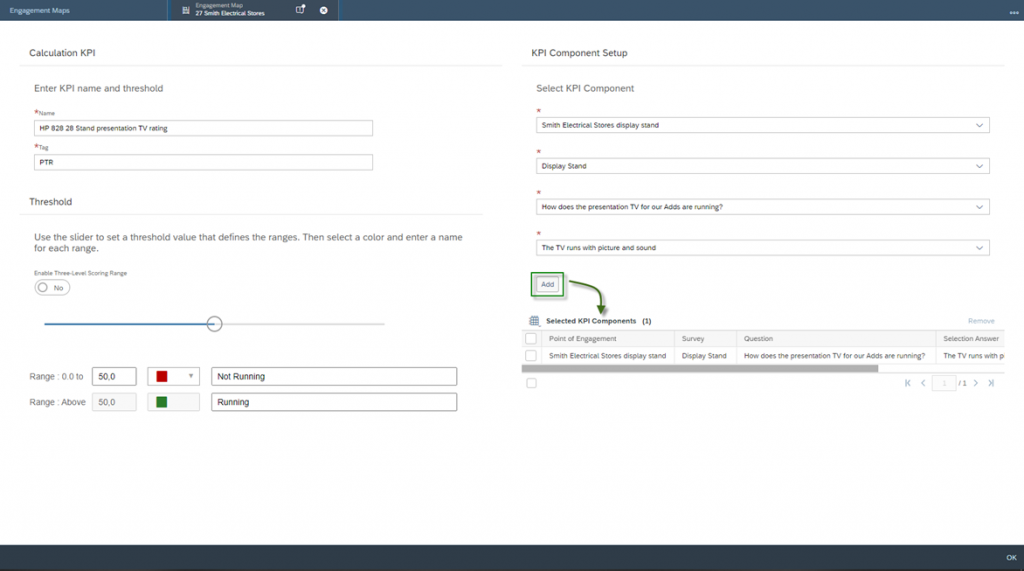
The Display Stand survey is used to evaluate the Display Stand for product HP 828‑28 in Smith Electrical Store. Multiple choice questions are asked here to check cleanliness and availability of the product. In this stand, a TV should be installed, which will present the advertisement of the product in picture and sound to the visitors of the store in continuous loop. A simple KPI should be created to show whether the TV is installed in the store. The following figure shows the settings made.
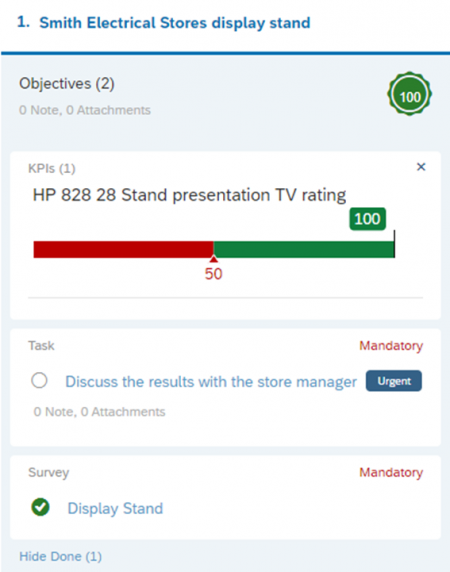
When performing the visit, the sales representative answers the Question How does the presentation TV for our Adds are running? with the Answer Option The TV runs with picture and sound.
In the calculation this answer is assigned with one point and the other answer options of this question are assigned with zero points. In the overview tile of the corresponding Engagement Point, you will now find the KPI displayed and evaluated to the value 100.
3.3. Advanced KPIs
With the Advanced KPIs you have the extended possibilities to include different surveys, questions, and answers for the calculation of customized KPIs. At this point, you have probably already noticed that the two KPIs Simple – Comparison and Simple ‑ Calculation have quite strong limitations. The following sections and fields are important when creating this KPI:
KPI Details
Name: Define a name for your KPI
Level: Select between Survey and Engagement Map. With the entry Survey you have the possibility to use several questions from only one survey as variables for your calculation. You can also work with this KPI Level with the weightage of Focus Products. With the entry Engagement Map, you can use as many Points of Engagements and surveys as possible for the calculation. You can also use other KPIs of your Engagement Map as Parameters. Focus Products are not available in this KPI Level
Identifier Tag: Assign a tag as a short name for your KPI
Scoring Relevant: Select between Scoring and Non-Scoring.
The Scoring entry means that scoring relevant KPIs are displayed as metrics during Perfect Store execution
Non-scoring relevant KPIs are not displayed as metrics during the perfect store execution. Non-scoring relevant KPIs should be used if they are used as an intermediate result for another KPI. When you use non-scoring relevant KPIs you can not define Targets and Thresholds
Targets
Enabled: Decide with this indicator if you want to use Targets
Show with KPI: Use this indicator to decide whether you want to display the Target value in the KPI during Perfect Store execution
Type: You can choose between Dynamic and Static. Static means that you manually enter a numeric value as a Target. Dynamic means that you compare your calculated key figure with a custom field on the Account Level
Value: For Type Static enter a Numeric Value and for Type Dynamic choose a Custom Field of the Account Level
Threshold
To be able to compare your calculated key figure in terms of a KPI, you need threshold values. Enter the value ranges – two or three ranges – define the threshold values and enter a description for each range. In the Advanced KPI you can also Calculate the Threshold as Percentage of your defined Target Values. Simply enable for this purpose the Indicator Calculate as Percentage of Target.
Formula Editor
The Formula Editor is structured into the following three sections:
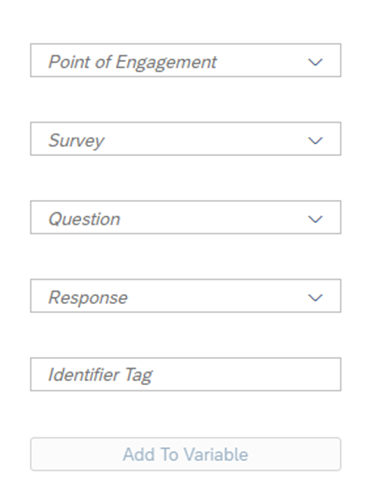
Define Variables
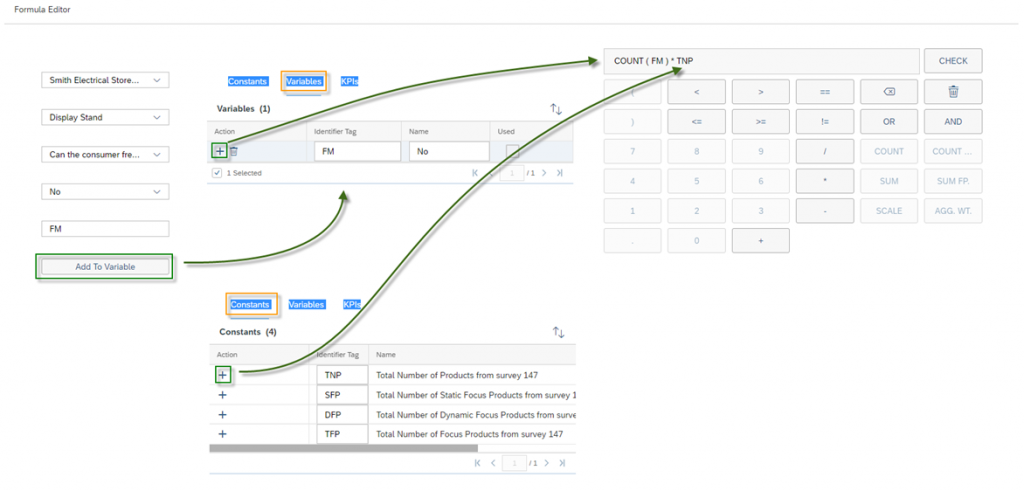
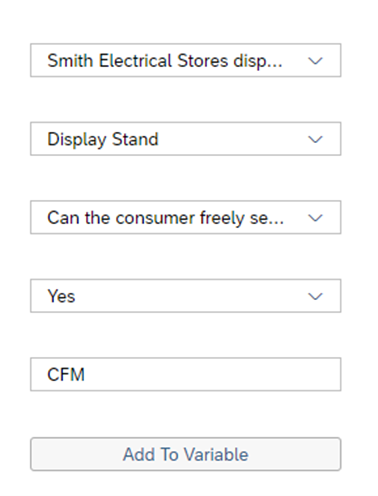
You can define variables based on a given Response to a Question. These questions are assigned to a Survey, which in turn is assigned to a Point of Engagement. Assign an Identifier Tag to this variable so you can use this in the calculator. Confirm with Enter on your Keyboard, which enables the Add To Variable Button. This Button adds your Variable to the Overview of Parameters Section. Following Question Types are available:
- Amount
- Multiple Choice (select multiple)
- Multiple Choice (select one)
- Numeric Value
- Product Extension Fields
- Product List Extension Fields
- Quantity
Overview of Parameters
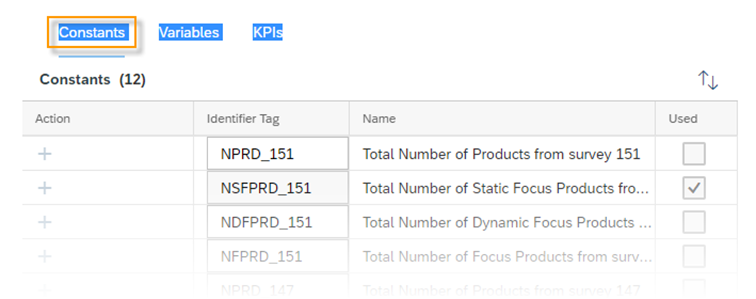
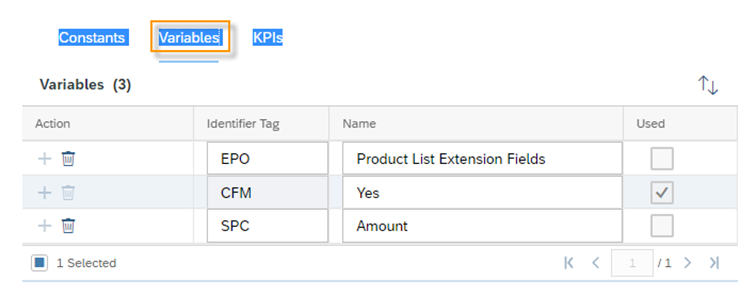
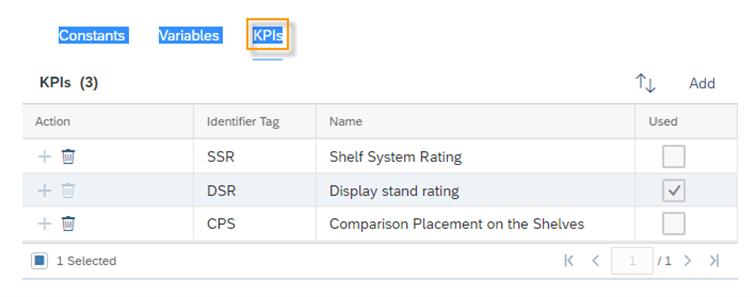
In the parameter overview you will find Constants, Variables and KPIs. The KPIs Tab is only available if you have selected the Engagement Map entry as the level. With the Add Icon ![]() you can use this parameter in your calculation. The Add Icon is selectable only if the syntax logic of the calculator allows it. Example 1: You can select a constant after the addition operator. Example 2: You can select a variable that is not numeric after the COUNT function. The Used indicator shows whether this parameter is already included in the calculation.
you can use this parameter in your calculation. The Add Icon is selectable only if the syntax logic of the calculator allows it. Example 1: You can select a constant after the addition operator. Example 2: You can select a variable that is not numeric after the COUNT function. The Used indicator shows whether this parameter is already included in the calculation.
Constants:
Here you will automatically find the following constants per survey used in your calculation:
- Total Number of Products
- Total Number of Static Focus Products
- Total Number of Dynamic Focus Products
- Total Number of Focus Products
Variables:
Can be defined and added in the Define Variables Section
KPIs:
Other KPIs can also be included in the calculation of an advanced KPI
Calculator
The calculator allows you to process all available parameters and build the function to determine your key figure. An overview of all operations can be found in the following table:
Operator and Functions of Formula Editor
Type | Name | Description | Example |
Operator | + | Addition | A+B |
– | Subtraction | A-B | |
* | Multiplication | A*B | |
/ | Division | A/B | |
() | Brackets – grouping operator | (A+B)*(C+D) | |
< | Less Than | A<B | |
<= | Less Than or Equal to | A<=B | |
> | Greater Than | B>A | |
>= | Greater Than or Equal to | B>=A | |
== | Equal to | A==A | |
!= | Not Equal to | A!=B | |
AND | Logical AND | (A==A) AND (B==B) | |
OR | Logical OR | (A==A) OR (B==B) | |
Function | COUNT | Returns the number of matches for variables or conditions | COUNT(A) |
COUNT(A AND B>C) | |||
SUM | Returns the sum of matches for variables or conditions | SUM(A) | |
SUM (A AND B>=C) | |||
COUNT FP | Count Function for Focus Products | COUNT FP.(A) | |
Count FP.(A and B>=C) | |||
SUM FP | Count Function for Focus Products | SUM FP.(A) | |
SUM FP.(A AND B>=C) | |||
AGG. WT. | Returns a total weighed count of matches for variables or conditions. Can only be used if Focus Products are defined. | AGG.WT.(A) | |
AGG.WT.(A AND B>C) | |||
SCALE | The set Scale Factor of your Engagement Map | A*SCALE |
The following figure visualizes the procedure for calculating an Advanced KPI. First the Variable FM is defined, which is the Answer No of the Question can the customer freely choose Music? This question is part of the Survey Display Stand of the Engagement Point Smith Electrical Store Display Stand. The Variable FM is then used to calculate the number of given No-Answers – Count(FM). At the same time, this result is multiplied by the Constant TNP, which is the Total Number of Products from survey 147 – Display Stand.
Focus Products
An excellent way to evaluate all products and services within your company is the BCG matrix. The BCG matrix is a framework developed by the Boston Consulting Group to evaluate the strategic position of the corporate brand portfolio. Based on this matrix, you can also derive your focus products for the Perfect Store. The matrix is as follows:
You can freely define your focus products that are central to your current market situation. This is important so that you can include these products in particular when calculating a Perfect Store score. You have already noticed that special calculation operators are available for Focus Products.
The focus products are only available when building the Advanced KPI on a survey level. The simple reason for this is that different surveys based on different engagement maps may have completely different targets. As an example, the display stand generally has only one product in focus, while the shelf system has significantly more products.
Statics Focus Products and Dynamic Focus Products are available when defining Focus Products. You will find this option on the very bottom when creating the Advanced KPI.
Static Focus Products
In the Static Focus Products, you can manually choose several products via the Add button and assign them a weighting for the calculation of the score. The weighting can be done manually by entering the values. While using this, make sure that the sum is always 100%. An alternative is to use the Equalize Weighting function, which assigns the same weighting to each product. You can connect the focus products to each other with an AND or OR operator.
AND Condition means that, the KPI score is calculated only if all focus products match the response or fulfill the condition defined by the formula. Otherwise, the KPI score is zero.
OR Condition means that, the KPI score is calculated if one of the focus products matches the response or fulfill the condition defined by the formular. Otherwise, the KPI score is zero.
You can assign the OR Condition by enabling the Checkbox under this column. Here are couple of examples:
Product HS 58-620 AND HS 90-648
Product HS 58-620 OR HS 90-648
Product HS 58-620 OR (HS 90-648 AND HS 41-826)
Dynamic Focus Products
For Dynamic Focus Products, you select them based on the Product Classification. The products included for this product classification all receive the same weighting.
The Customer Experience team at Camelot ITLab deals with exciting and challenging CRM related topics every day and serves a large portfolio of different customers from a wide range of industries. Trust in this collaboration and feel free to contact us at tlil@camelot-itlab.com.
Was this article helpful?
If you like our content we would highly appreciate your review on Trustpilot
#SAP C4C #SAP Cloud 4 Customer #Cloud 4 Customer #Cloud for Customer #SAP Sales Cloud #Sales Cloud #Retail Sales #Perfect Store #Store #Layout #Store Layout #Engagement Map #Point of Engagement #Engagement Point #Focus Products #KPI

